Gas and Oil real time MOT monitoring
Desktop, online, and realtime services.
Prepared for Avin Pishtazan Behsa
Industrial well-test monitoring
An industrial well-test / production-test-separator monitoring platform. The product UI is branded MOT — Monitoring.
Web and mobile are monitoring-only — no plant setpoint writes (per the project design decisions).
This page does not present the online or realtime service as a live deployment.
Process covered
From the design document, derived from a seven-sheet signal workbook and P&ID.
- Choke manifold pressure/temperature (UCP/UCT, DCP/DCT)
- Desander and desilter differential pressure
- Three-phase test separator (gas/oil/water levels, high/low level switches)
- Orifice gas metering
- Coriolis oil flow and density
- Surge tanks
- Plunger/charging pump skid
- H2S and methane detectors
- Alarm light/horn
- ESD status
- 33 tagged process signals (29 conventional I/O Signal, 4 Ethernet on the pump skid)
- About 15 config parameters
- 6 derived calculations (e.g. GOR, Coriolis net-oil correction, surge-tank volume, pump-out volume)
What it does
Five pillars of the monitoring platform.
Process monitoring
Signals across choke, separator, metering, tanks, pump, hazardous gas, and ESD.
Dual-endpoint communication
PLC via Modbus TCP plus the Ethernet pump skid.
Multi-shell UI
Windows WPF (.NET 8) desktop host with WebView2 embedding a shared React UI; Next.js 15 web shell (monitoring only); Flutter mobile shell with WebView of the same UI.
Historian and alarms
PostgreSQL + TimescaleDB for long-range trends; alarm and reporting services.
Monitoring-only safety
Web and mobile without plant control writes; BPCS not SIS; audit before write; AI readiness with no plant write.
Desktop, online, realtime
The three services named in the brief — with no live-deployment claim.
Desktop and web
Desktop host with the shared UI, and a monitoring-only web shell with sections such as Dashboard, Live metrics, Process Mimic, Trends, Alarms, Reports, and Admin; EN/FA toggle and a View only badge.
Realtime and sync
Backend services for ingestion, realtime, alarm, and reporting; REST + WebSocket; offline-first sync; SQLite on desktop.
Design decisions from the project docs
Architecture summary — not a public deployment claim.
- FastAPI/Python services (ingestion, realtime, alarm, reporting, AI-readiness, PLC simulator)
- Redis pub/sub; Keycloak OIDC and an RBAC capability matrix
- Docker/Kubernetes IaC; about 40 ADRs
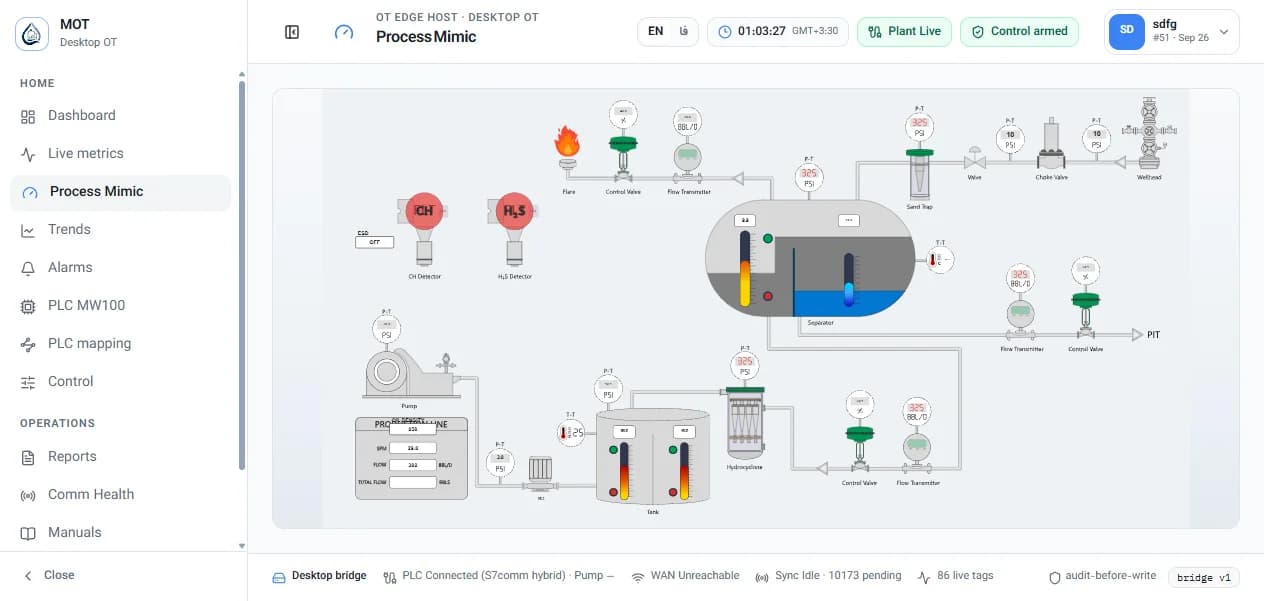
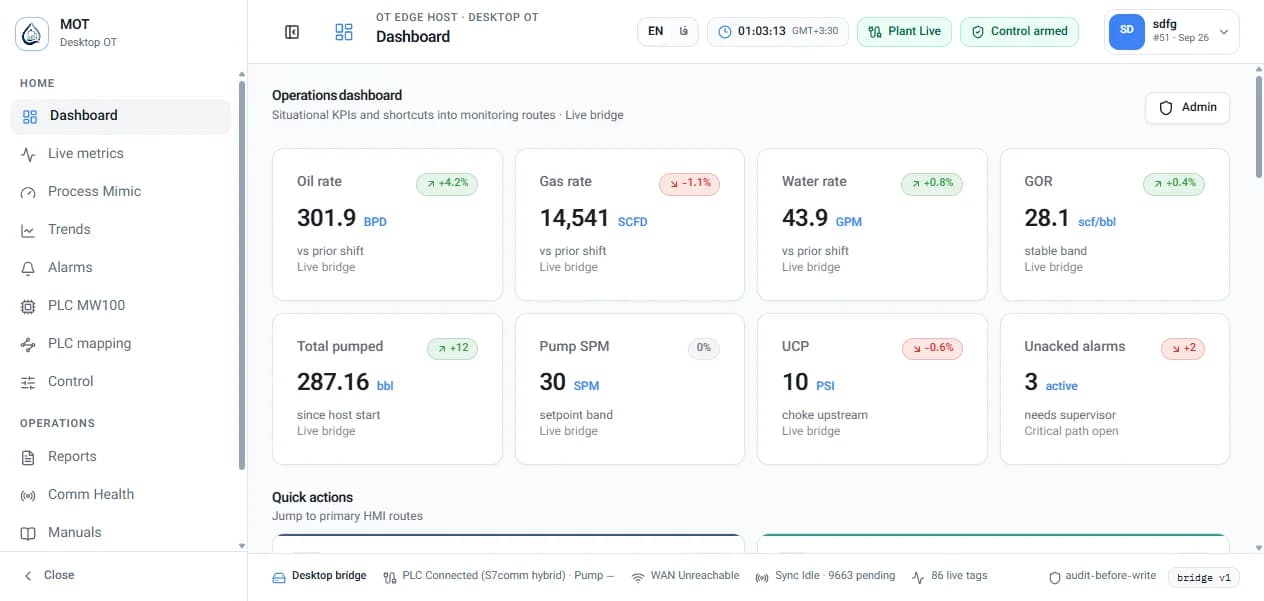
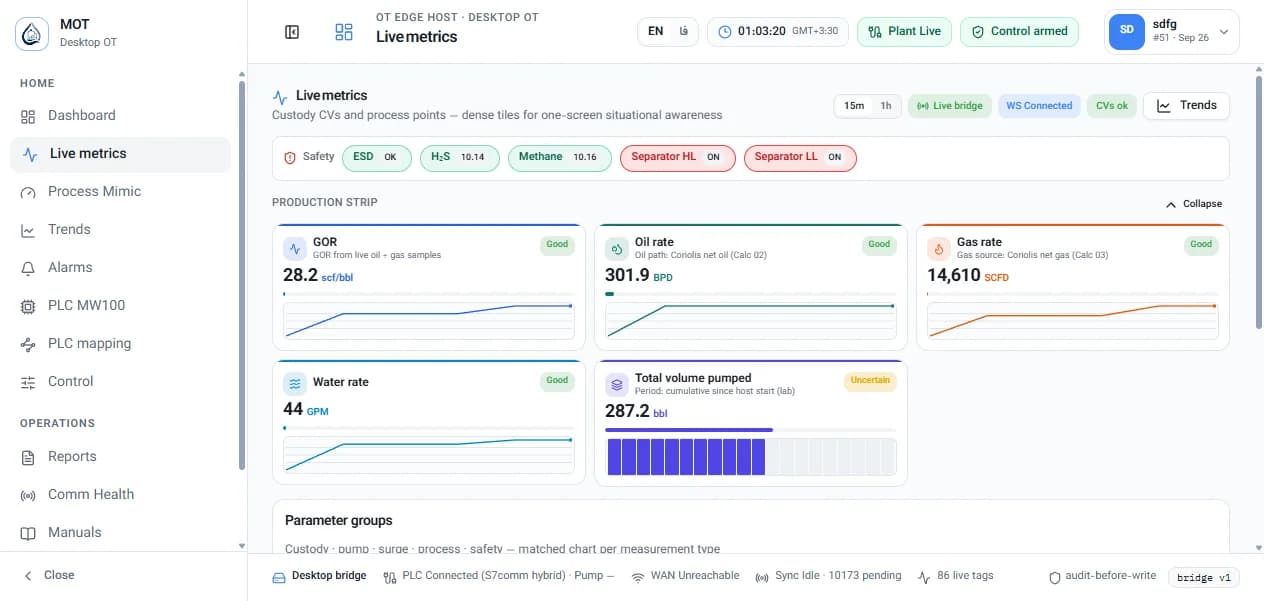
Monitoring shell UI screens
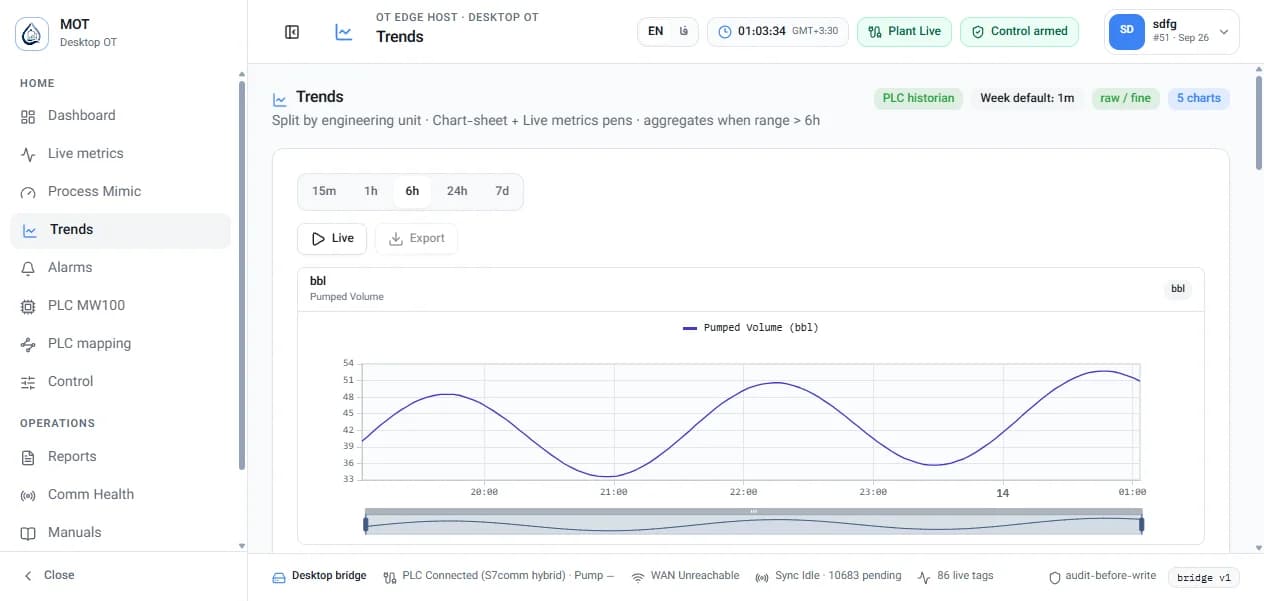
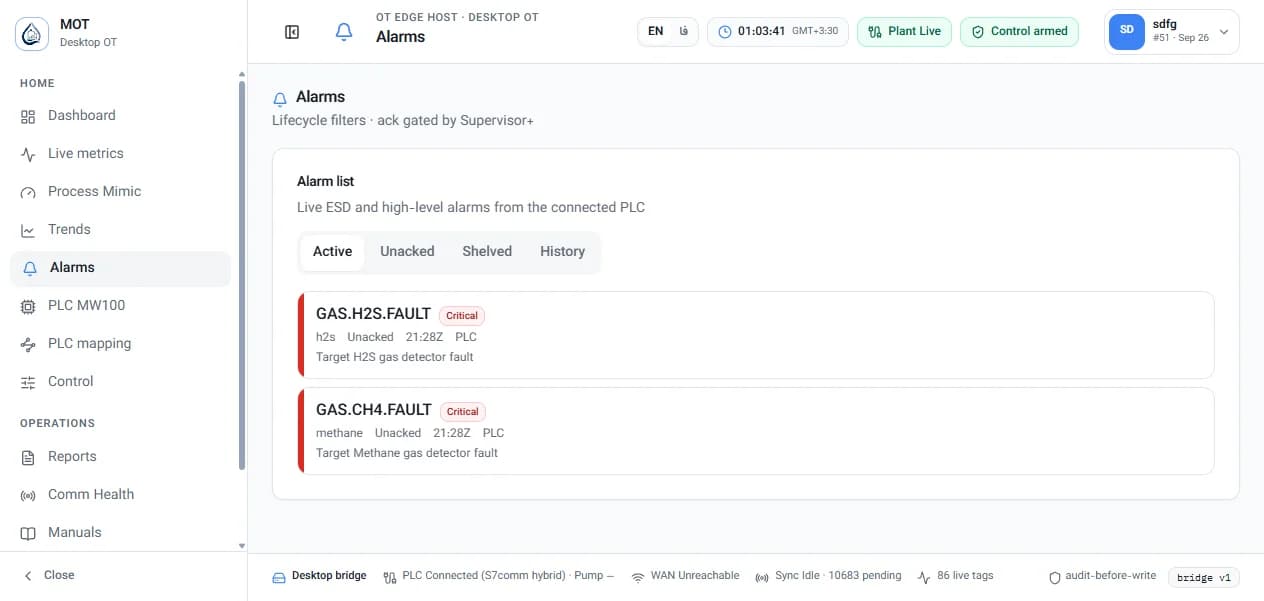
Screenshots from the desktop host connected to the project's PLC simulator — simulated process data, not a real plant and not a deployment.
Operations dashboard — KPIs
Process Mimic — schematic with tag callouts
Live metrics — tiles and sparklines
Trends — chart
Alarms — H2S and CH4 gas detector faults
Safety and monitoring stance
Web and mobile are monitoring-only — no plant setpoint writes
BPCS not SIS; audit before write; AI readiness with no plant write
Web sections: Dashboard, Live metrics, Process Mimic, Trends, Alarms, PLC MW100, Reports, Comm Health, Manuals, Config, Admin